
Focus efforts on one planning issue or vulnerable area for which the data will make the difference.
Increased generation of knowledge thanks to digital technology must enable better orientation of the local authorities’ decisions. Regarding developing cities, the work of diagnosis and mapping rapidly growing urban areas often remains incomplete or non-existent. The response of the local authorities can therefore only be partial, but digital tools gradually provide a mass of up-to-date sector information.
When it is a question of making urban planning decisions specific to improving the living conditions of the most vulnerable, the stakes for the local authority are double:
- in a “normal” situation, use existing data and data generated by the inhabitants to be able to design responses adapted to the uses and conditions of urban development, which favour population inclusion;
- in emergencies, coordinate public action on a poorly known territory, in particular in critical situations of natural disaster where the population is in danger.
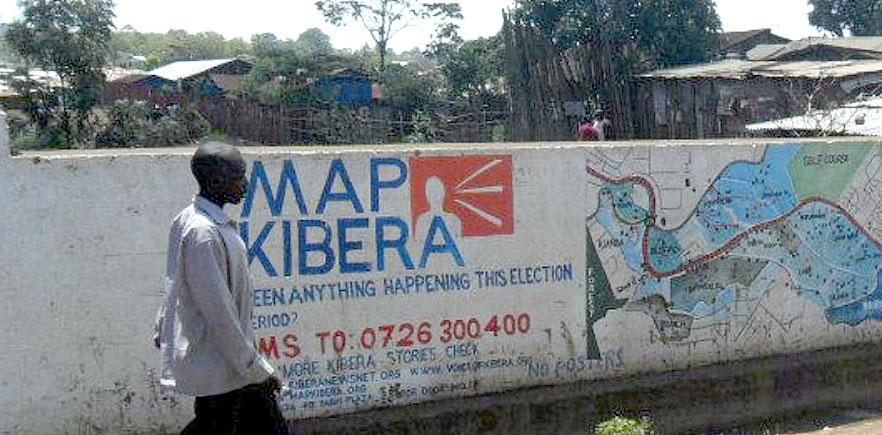
MapKibera: participatory mapping
Nairobi, Kenya
Digital tools fed by satellite images and knowledge of the population make it possible to map an unplanned, insecure neighbourhood, identify the zones at risk and improve security.
The MapKibera initiative was introduced in the neighbourhood of Kibera in Nairobi (Kenya) at the beginning of 2009 to improve the consideration given to the communities by the stakeholders working in underprivileged areas. This is one of the largest unplanned districts of Nairobi, with no maps, addresses or listing of the streets or public facilities.
A free, open digital map was created on OpenStreetMap and a community of young Kiberian volunteers, trained by geographers, are in charge of updating it.
The recording and listing of the location of services, markets, schools, clinics, pharmacies, toilets and water taps in the neighbourhood made it possible to create a mapping database. The data was collected by the members of the local communities via GPS equipment and completed by questionnaires to the population. Computer equipment was made available which enabled mapping information to be edited and published online.
The initiative then developed complementary services:
- a map created in partnership with UNICEF showing areas of danger, with no street lights, where rapes had been committed and to create a police station in the location of one of these black spots;
- a blog and place to notify of any problems affecting the community via the WordPress CMS CMS Content Management System, software for the design and dynamic updating of websites or multimedia applications. and the Ushahidi system. During critical events, volunteers and inhabitants can send an SMS to the team to ask for help or to circulate information and feedback their needs.
The initiative has had spin-offs in the Mathare and Mukuru districts in Nairobi.
Lessons learnt
- This initiative was developed under the initiative of NGOs and enabled the collection of information potentially useful for public intervention and the local authority.
- Mapping tools had a real empowerment effect and boosted the self-esteem of the locals.
In both cases, digital technology allows knowledge production to be opened to the population, beneficiaries of the investments to be made. The local authority can make use of cheap technologies (GPS, SMS, online mapping systems) to help with decision-making and information-sharing through social networks. Decisions are more legitimate because they are based on the data generated by civil society and inhabitants.
There is a risk of being “overwhelmed” by the quantity of data and information produced rapidly and massively by mobilising citizens. It is therefore necessary to carry out prior work upstream:
- design a geographic information system that can gradually enrich the database and combine them depending on the needs of the moment;
- identify the vulnerability of public facilities at risk, evacuation centres and access routes for emergency services;
- fit alarm systems that can be activated by SMS.
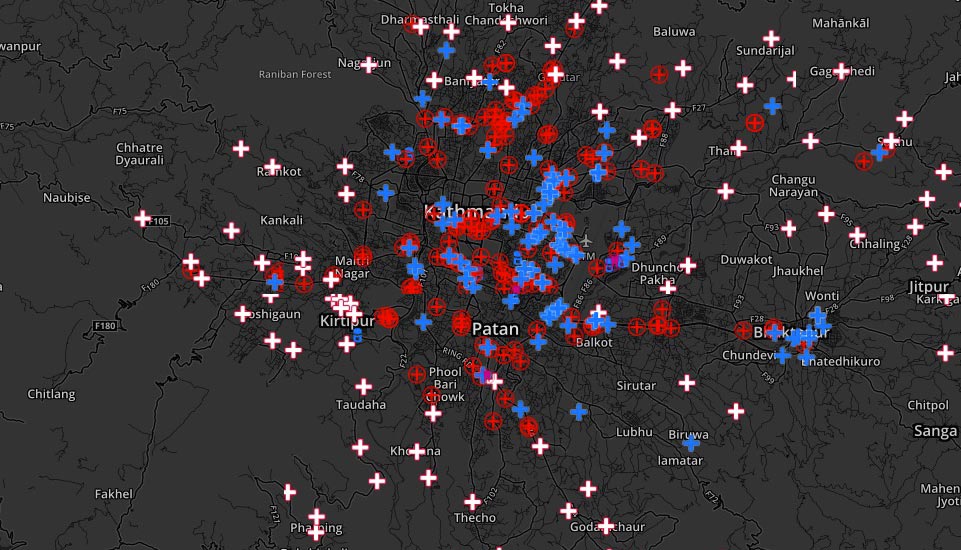
Open Cities Project: risk mapping
Kathmandu, Nepal
A map of infrastructure and equipment, a mobile problem alert application and an interactive mapping system to inform the public of the projects in the neighbourhoods.
In 2012, Kathmandu benefited from a partnership between the central government and the Global Facility for Disaster Reduction and Recovery managed by the World Bank, to improve prevention and preparation for seismic risks. The project promotes the use of open data for urban resilience. It can be used to digitize the built environment, the road network and other critical facilities, and establish their vulnerabilities to a contingency to be able to subsequently organise the necessary interventions.
Students and inhabitants have been enrolled to create a map of the valley on OpenStreetMap. The data was collected by setting up crowdsourcing Crowdsourcing Consists in the use of information, creativity, expertise or intelligence of a large number of people through the intermediary of a platform. From an economic approach, it may be a question of distributing a large number of tasks for the lowest cost. From a collaborative, social or altruistic approach, it is a question of making use of the specialist or volunteer networks of the general public to collect or process information. mechanisms and training a local community of volunteers: the first year, more than 2,300 people took part in the training workshops.
Different mechanisms were implemented:
- mapping of infrastructure and facilities (hospitals, schools, evacuation routes);
- mobile application allowing citizens to notify and map urban malfunctions (holes in the road, illegal dumping of waste, etc.);
- interactive mapping system to inform the public of programmes and projects in the neighbourhoods.
During the 2015 earthquake, the team centralised information via an online platform (Quake) to list the needs of affected people and coordinate first aid and humanitarian actions among civil society organisations, volunteer and civil defence groups. Ushahidi (for sending information or SMS by application or the geolocalisation of voice calls) was also mobilised to locate the victims.
A local NGO, Kathmandu Living Labs, was supported to carry out management and maintenance of the system and ensure the training of contributors in the long term.
http://www.opencitiesproject.org/cities/kathmandu/
Lessons learnt
- Free technical tools were used to map the baseline situation and help to improve disaster risk reduction.
- Stakeholders’ coordination facilitated by ICT. The experiment can be reproduced by municipalities which can conduct this type of collaborative project.
Dhaka-Innovate: mapping of informal settlements by remote detection
Dhaka, Bangladesh
Slum mapping to study trends in urban development and the propagation of pollution and disease.
In 2013, a research team from Humboldt University of Berlin analysed Dhaka’s satellite data for the period 2006-2010. Considering that the lack of knowledge on the spatial occupation of a city, in particular its informal neighbourhoods, is an obstacle to public action, the aim was to map the slums of Dhaka.
The study took place at a distance by remote detection using several sources of data which had been scattered and under-used up till then:
- Quickbird high definition satellite imagery for the period 2006-2010;
- “Slums of Urban Bangladesh, Mapping and Census 2005”, a report which described the underprivileged neighbourhoods of Dhaka in 2005;
- Older geolocalised photos and Google Earth.

This data was integrated in the same format into a GIS GIS Geographic information system: system designed to gather, store, process, analyse, manage and display all types of spatial and geographic data . An analysis of the impacts on public health was conducted, enabling inter alia the integration of informal dynamics on the development of Dhaka and environmental change. Data processing allowed a predictive model to be developed showing the trends in urban development and the propagation of pollution and disease.
http://www.megacities-megachallenge.org/dhaka3.php
http://gdi.geo.hu-berlin.de/wiki/Dhaka
Lessons learnt
- The support of a university for data collection, processing and slum mapping was a condition for success.
- Harmonised and geolocalised data in a public database can be re-used to examine other development processes and challenges.
Participatory mapping of precarious neighbourhoods
Dar es Salaam, Tanzania
Maps to prevent risks and a citizen reporting system.
Dar es Salaam is particularly vulnerable to flooding and 70% of the population lives in informal neighbourhoods. To reduce the vulnerability to risks of these insecure residential areas and improve preparation for risk management, the municipality instigated the mapping of Tandale, one of the largest precarious neighbourhoods, in 2013.
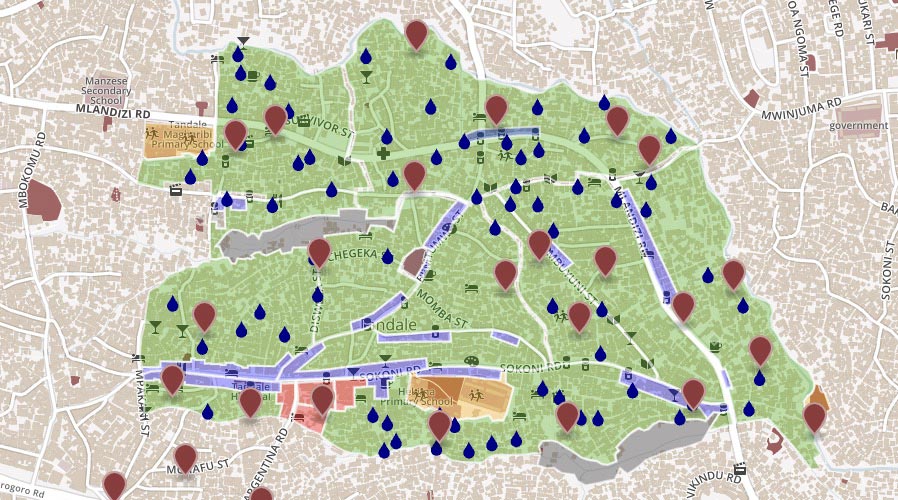
Inspired by the initiative MapKibera (Kenya), students in urban planning and inhabitants were trained and engaged to take an inventory of the existing facilities on OpenStreetMap, from an approach of awareness raising to solidarity and capacity building.
Free open source software (GeoFabrik and Tilemill) were then used to publish the maps on the Internet. Drones identified the areas most likely to be affected by flooding. This work produced maps of risk exposure and evacuation routes, also enabling the identification of the areas where flooding could cause epidemics.
In 2017, the collected, processed and published data covered 1.3 million people and fed online tools (OpenStreetMap and InaSAFE –QGIS module) which can be used by communities, without prior knowledge of programming. The funding served to create the maps, but also to set up the resources necessary for a citizen reporting exercise (identification of epidemic centre, etc.). A platform similar to Ushahidi (use of SMS or voice calls to list information) was introduced.
http://explore.ramanitanzania.org/
Lessons learnt
- The municipality engaged local human resources for data collection.
- Collaborative mapping with the inhabitants was done on free software and made available in open access Open access The making available online of digital content which may itself be free or under an intellectual property regime, but open access. In theory, open access can include access to data to allow data mining. .
Share:
![]()
![]()
![]()
 Clarify expectations about digitalization of urban and spatial planning
  Perform a self-diagnosis of available and usable data for planning and crisis and disaster management
 Identify the partners and ecosystem capable of producing urban data
  Start with pilot actions to test simple solutions
  Define a roadmap to ensure public responsibility for urban planning data
  Assess, learn and enrich the data for territorial knowledge, and communicate on possible contributions
